Java Play Framework metrics
Overview
Monitoring is really important for your production services. This is especially true for microservices architecture which is more and more popular in last years. Why it is important? Imagine you have slowdown in your service - how are you going to find the culprit across dozens of different services? What if users are reporting slow downs, or performance test results are bad? How are you going to find what is slow? You need to have something telling you how long it took to process given request.
There are couple problems with monitoring across the service, to name few:
- Not best support from the framework you are using
- Differences in monitoring if you are using different technologies, libraries
- Issues with gathering your metrics across the board if they are in different format
- It doesn’t help if you are looking for free solution
In this post I wanted to show how it is possible to add great Code Hale Dropwizard metrics to Play Framework so the metrics format could be similar for different approaches (Dropwizard and Play Framework in this case).
Introduction
On my current project we can run only Play Framework 2.3.10. There is environment we do not control and it does not have Java 8 which is required by newer Play Framework. This is unfortunate, because the implementation would be a bit easier in latest Play Framework. Please feel free to provide updated implementation for 2.4 or even 2.5. Additionally, this is Play Java (there is something similar I wrote but for Scala). If you don’t know Play Framework you can stop reading this post and just go to: Play Framework for some additional information.
I was not able to find implementations for this particular Play version, so I decided to start implementing my own solution. It is by no means complete, but I think it is good starting point and show how easily you can integrate metrics into any application.
You can find source code of Play Framework project with monitoring build on top of it here. Don’t hesitate to use this repo as skeleton for new projects.
General monitoring
The heart of all Dropwizard metrics monitoring is MetricsRegistry class, which can be created using parameterless constructor. Then using it you can register a lot of helpful metrics.
The most basic monitoring offering by library is generic JVM monitoring. It is really easy to add to existing MetricsRegistry:
metrics.registerAll(new MemoryUsageGaugeSet());
metrics.registerAll(new GarbageCollectorMetricSet());
The above lines will capture metrics for various memory information (like heap usage, max memory, eden space, perm gen, etc.) and how the garbage collectors is behaving (depending on the GC setting, but you can see information like MarkAndSweep times, scavenge counts and timings). The Dropwizard metrics library has some others like: ClassLoadingGaugeSet, ThreadDeadlockDetector, ThreadDump, refer to documentation to more.
Requests monitoring
Apart from generic JVM internals monitoring Dropwizard metrics offers a lot of generic components which you can use to create your own meters. For Play Framework I mostly decided to use two: Timers and Counters. Timers are especially great for calculating requests monitoring. I wrote some code around to capture all requests which are annotated with @Timed, you can see how your endpoints are performing and what’s the request processing time. It has a lot of statistical information out-of-the-box like: mean, average, 75th percentile, 95th percentile, rates, median, standard deviation, number of requests and more. Slow endpoint is visible immediately.
Long story short: just add @Timed to your methods in Play controller and they will be automatically instrumented (if you started with my Play code).
Internal requests monitoring
Another important thing for us is monitoring of internal requests the Play Framework is making. In our architecture the Play serves only frontend purpose and is querying a lot of backend services for data using Play’s HTTP client. I wrote small WSRequestHolder factory which is preparing instrumented request. If you use it you will be able to see exactly the same timing as for actions annotated with @Timed. Here is the example (not really creative, but you can see how it is used):
    WSRequestHolder instrumentedWSRequestHolder = WSRequestFactory.getInstrumentedWSRequestHolder("http://www.google.co.uk", "google");

    return instrumentedWSRequestHolder.get().map(new F.Function<WSResponse, Result>() {
        @Override
        public Result apply(WSResponse wsResponse) throws Throwable {
            return ok(wsResponse.getBody());
        }
    });
Displaying metrics information
Of course it doesn’t give you anything if the metrics are in the memory only. Dropwizard metrics can be reported to many different places easily, like console, ganglia or graphite. I will add support for this in my skeleton application so it will be configurable as any other Play Framework configuration element.
Additionally, application can report this under some URL - this is what I did for my skeleton, there is /admin servlet which is reporting all metrics in the JSON format.
Quick word about performance
I ran some performance tests to check if my monitoring enhancements have got any adverse impact on response times from the Play application. I deployed the application on Heroku free Dyno, it has got 512 MB of RAM, 4 Virtual Cores, but it’s computation power is not specified in the documentation. For requests I used jMeter on my Macbook Pro (Early 2015 (MacBook 8,1). 1.3 Ghz, 8Gb RAM 1600 Mhz DDR3, 256Gb SSD (FileVault enabled), Intel HD Graphics 5300 1536Mb. El Capitan, 10.11).
Before I started to capture timings, I ran around 10k requests as a warmup. The test was using 100 threads. Workers were hitting various application endpoints: one with monitoring, another without, one was throwing error. I tested the internal HTTP client instrumentation as well - it was making the request to the Google home page and simply returning the HTML.
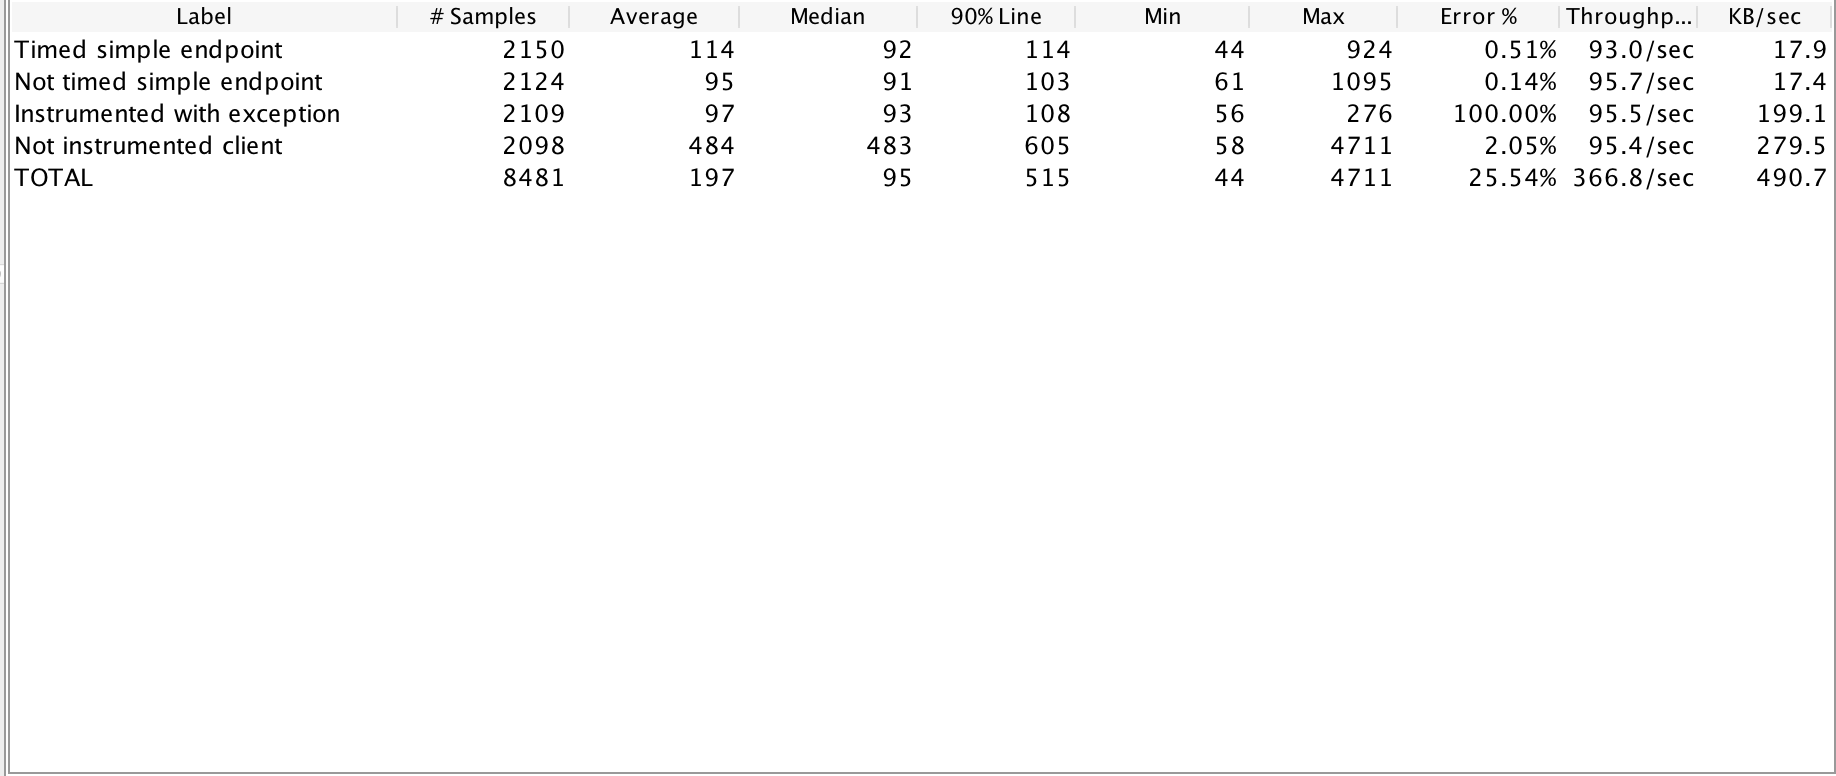
Please see results presented on below screenshots.
Not instrumented
Instrumented
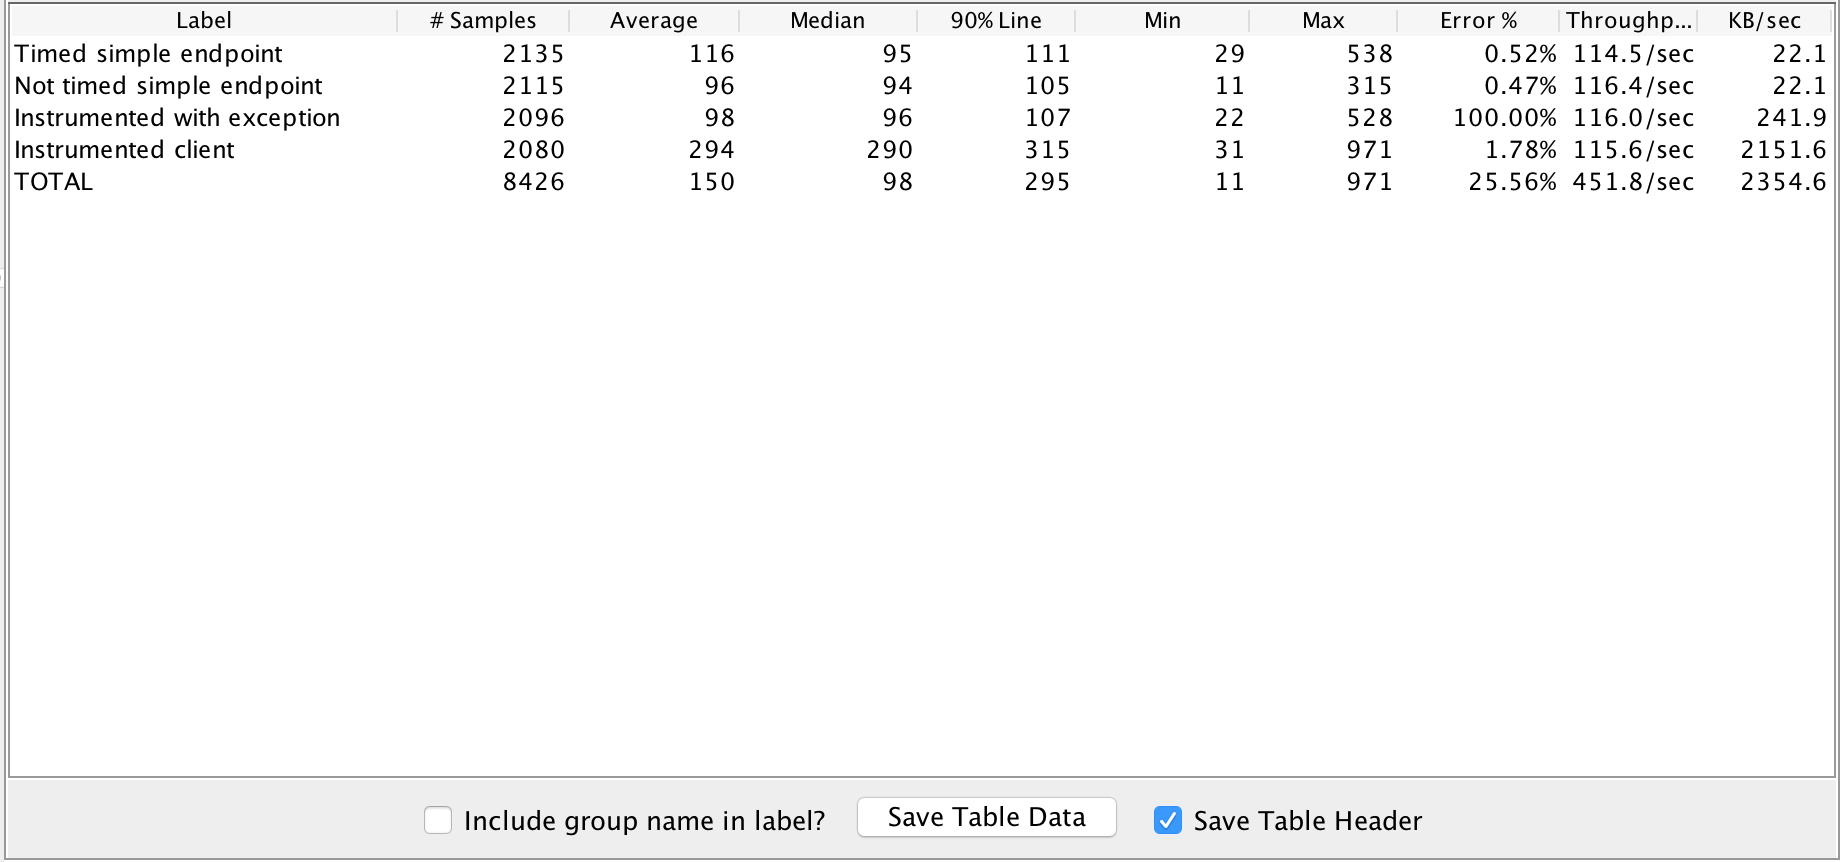
As you can see there is no performance impact. The 90% timings were almost the same in both cases, the difference is minimal and such small difference is worth having additional information about the platform. The errors you can observe in the results are caused by the interruption of performance tests in JMeter, all requests were handled successfully.
The clients timings are a bit unexpected, but they are dependant on the upstream component - Google homepage, which was probably throttling my requests after hitting mark of over 20k in really short amount of time. Most importantingly there is no slowdown of instrumented version.